Linear regression is a statistical method used to model the relationship between two variables. It allows us to understand the nature and strength of the association between the dependent variable and one or more independent variables. AP Statistics tests often include questions that assess students’ understanding and ability to analyze linear regression.
In an AP Statistics test, students may be asked to interpret the slope and intercept of the regression line, analyze residuals to assess the model’s fit, or make predictions based on the regression equation. These questions require a solid understanding of concepts such as correlation, causation, and the properties of a linear regression model.
One common question type is interpreting the slope of the regression line. Students are expected to understand that the slope represents the change in the dependent variable for every unit increase in the independent variable. It is essential to comprehend whether the slope indicates a positive or negative relationship and to explain the meaning of this relationship in the context of the specific variables being studied.
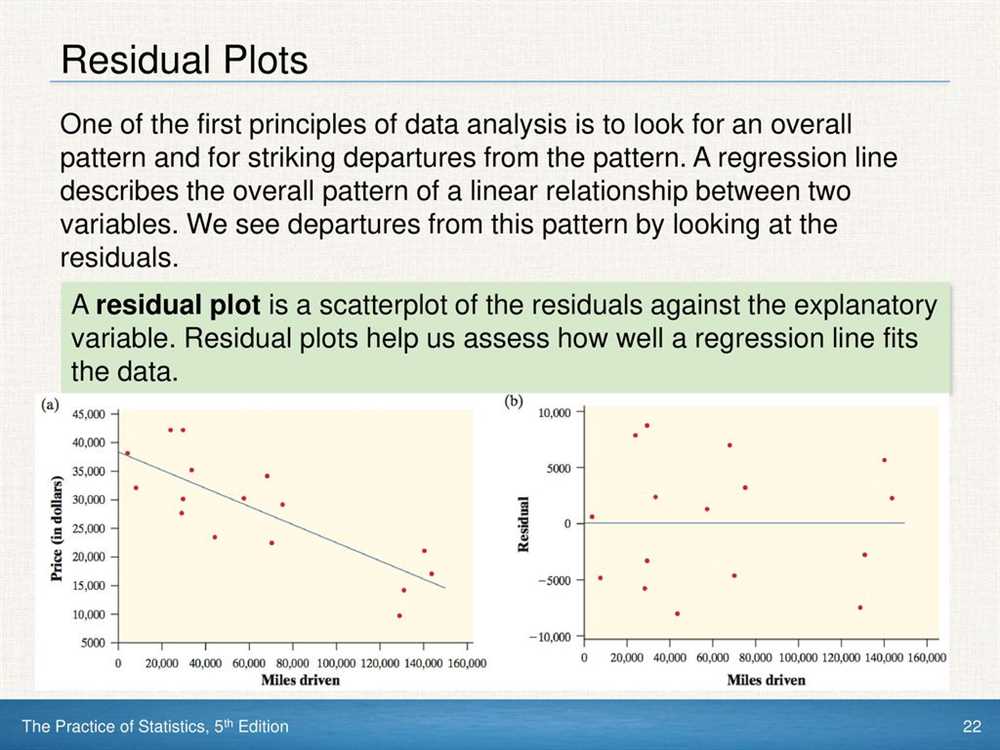
Another important aspect of analyzing linear regression is evaluating the goodness of fit of the model. Residual analysis is used to determine whether the model adequately captures the observed data. Students may be asked to interpret residuals, identify outliers, or discuss the appropriateness of the linear regression model given the data at hand.
What is a linear regression in AP Statistics?

Linear regression is a statistical method used in AP Statistics to model the relationship between two variables. It is a powerful tool for analyzing and predicting the behavior of a dependent variable based on one or more independent variables. In simple terms, linear regression helps us understand how changes in one variable can affect another.
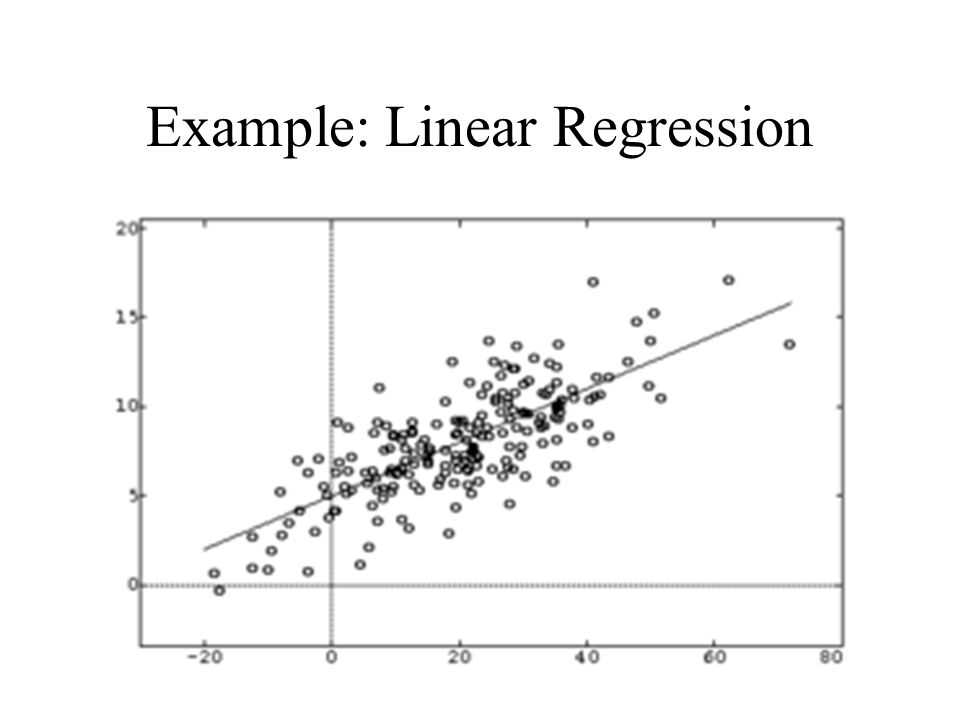
When conducting a linear regression, the goal is to find a linear equation that represents the best fit line through a scatterplot of the data. This equation can then be used to estimate the value of the dependent variable for a given value of the independent variable. The equation takes the form of y = mx + b, where “y” represents the dependent variable, “x” represents the independent variable, “m” represents the slope of the line, and “b” represents the y-intercept.
Linear regression is widely used in various fields, including economics, finance, sociology, and medicine, to name a few. It provides a quantitative understanding of the relationship between variables, allowing for data-driven decisions and predictions. In AP Statistics, students learn how to calculate and interpret regression coefficients, assess the goodness of fit of a regression model, and use regression to make predictions and analyze the significance of relationships between variables.
In conclusion, linear regression is a fundamental concept in AP Statistics that helps us understand and quantify relationships between variables. It allows for the analysis, prediction, and interpretation of data, making it a valuable tool for making informed decisions in various fields.
How is a linear regression model used in AP statistics?
In AP Statistics, a linear regression model is an important tool for analyzing and understanding the relationship between two variables. A linear regression model is used to determine if there is a linear relationship between the dependent variable (response variable) and the independent variable (explanatory variable). The model allows statisticians to make predictions and draw conclusions based on the observed data.
One of the main uses of a linear regression model in AP Statistics is to analyze the strength and direction of the relationship between the variables. By fitting a line to the data points on a scatter plot, statisticians can determine if there is a positive or negative correlation between the variables. They can also calculate the coefficient of determination, which measures how well the regression line fits the data and provides an indication of the strength of the relationship.
In addition to determining the strength and direction of the relationship, a linear regression model can also be used for prediction. After fitting the regression line to the data, statisticians can use the model to make predictions about the value of the dependent variable based on a given value of the independent variable. This can be particularly useful when trying to forecast future trends or estimate an unknown value.
In summary, a linear regression model is a valuable tool in AP Statistics for analyzing the relationship between two variables, determining the strength and direction of the relationship, and making predictions. It allows statisticians to draw meaningful conclusions and make informed decisions based on the observed data.
Understanding the key concepts of a linear regression
A linear regression is a statistical analysis technique that aims to model the relationship between two variables, typically referred to as the independent variable and the dependent variable. The goal of a linear regression is to find the best-fitting straight line that represents the relationship between these variables. This line can then be used to make predictions about the dependent variable based on the values of the independent variable.
There are several key concepts that are essential to understanding linear regression. The first concept is the linear relationship assumption, which states that there is a linear relationship between the independent and dependent variables. This assumption is important because if the relationship is not linear, then a linear regression model may not be appropriate.
The next concept is the line of best fit, also known as the regression line. This line represents the best estimate of the relationship between the independent and dependent variables. It is determined by minimizing the sum of the squared differences between the observed values of the dependent variable and the predicted values from the regression line.
Another important concept is the coefficient of determination, also known as R-squared. This value represents the proportion of the variance in the dependent variable that can be explained by the independent variable(s). A higher R-squared value indicates a stronger relationship between the variables.
The final concept is the standard error of the estimate. This is a measure of the accuracy of the predictions made by the regression model. It represents the average amount that the observed values of the dependent variable deviate from the predicted values. A smaller standard error of the estimate indicates a more accurate model.
In conclusion, understanding the key concepts of a linear regression is crucial for conducting and interpreting statistical analyses. By considering the assumptions, regression line, coefficient of determination, and standard error of the estimate, researchers can gain valuable insights into the relationship between variables and make informed predictions.
Steps to Perform a Linear Regression Analysis

Linear regression analysis is a statistical method used to model the relationship between a response variable and one or more predictor variables. It helps in understanding how changes in the predictor variables affect the response variable. The main goal of linear regression analysis is to fit a line or a curve to the data in order to make accurate predictions or determine the strength and direction of the relationship between the variables.
To perform a linear regression analysis, the following steps are typically followed:
- Data collection: Gather the relevant data for the response variable and predictor variables. The data should be representative and collected in a systematic manner to ensure accuracy and reliability.
- Data exploration: Analyze the collected data to understand the distribution, identify any outliers or missing values, and check for any patterns or trends. This step involves plotting scatter plots, histograms, and other graphical representations to visualize the data.
- Model specification: Decide on the appropriate type of linear regression model based on the nature of the data and the research question. This step involves selecting the predictor variables and determining the functional form of the model (e.g., linear, quadratic, or exponential).
- Parameter estimation: Use statistical techniques, such as the method of least squares, to estimate the parameters of the regression model. This step involves finding the best-fitting line or curve that minimizes the sum of the squared differences between the observed and predicted values.
- Model evaluation: Assess the quality of the regression model by examining the goodness-of-fit measures, such as the coefficient of determination (R-squared), adjusted R-squared, and p-values. This step helps in determining the overall validity and reliability of the model.
- Interpretation and inference: Interpret the estimated coefficients of the regression model to understand the relationships between the predictor variables and the response variable. Perform hypothesis tests and confidence interval estimations to draw meaningful conclusions about the population parameters.
- Prediction and visualization: Use the fitted regression model to make predictions for new data points or scenarios. Visualize the results using graphs or plots to communicate the findings effectively.
In conclusion, performing a linear regression analysis involves several essential steps, including data collection, exploration, model specification, parameter estimation, model evaluation, interpretation and inference, and prediction. Following these steps can assist statisticians and researchers in understanding the relationships between variables and making accurate predictions.
Interpreting the results of a linear regression

When conducting a linear regression analysis, it is important to interpret the results in order to draw meaningful conclusions about the relationship between the variables. The regression output provides several key pieces of information, including the coefficient estimates, standard errors, t-values, and p-values.
The coefficient estimates represent the estimated effect of each predictor variable on the response variable. These coefficients provide insight into the direction and magnitude of the relationship. A positive coefficient suggests a positive relationship, meaning that as the predictor variable increases, the response variable also tends to increase. Conversely, a negative coefficient indicates a negative relationship where an increase in the predictor variable is associated with a decrease in the response variable.
The standard errors measure the variability of the coefficient estimates. Lower standard errors indicate greater precision in the estimates, suggesting more reliable results. The t-values are derived from the coefficient estimates and standard errors, and they indicate the significance of the relationship. A t-value greater than 2 (or less than -2) suggests that the coefficient estimate is statistically significant at a 95% confidence level.
The p-values are another measure of statistical significance and provide the probability of observing a relationship as strong as or stronger than the one observed in the data, assuming there is no true relationship in the population. Typically, a p-value threshold of 0.05 is used to determine statistical significance. If the p-value is less than 0.05, the relationship is considered statistically significant.
Overall, interpreting the results of a linear regression involves analyzing the coefficient estimates, standard errors, t-values, and p-values to determine the presence and strength of a relationship between the predictor and response variables. These interpretations can help researchers make informed decisions and draw accurate conclusions in their statistical analysis.
Assumptions of a linear regression model

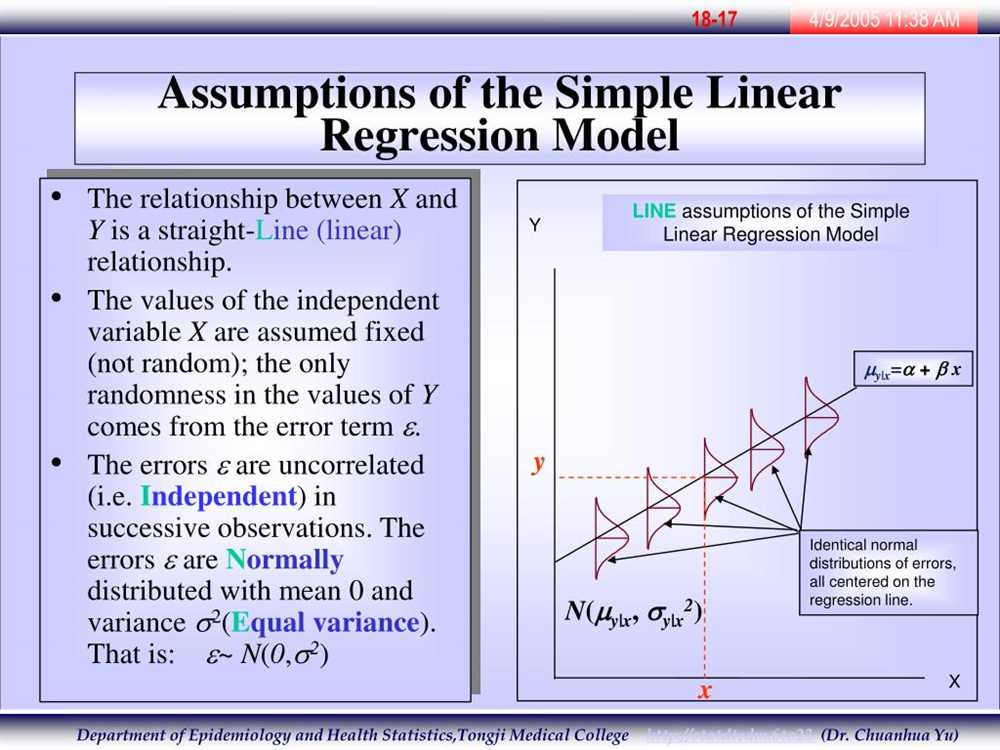
A linear regression model is a statistical tool used to understand and analyze the relationship between two variables. However, to ensure the accuracy and reliability of the model, certain assumptions need to be met. These assumptions are essential for interpreting the results correctly and making valid inferences.
Linearity: One of the key assumptions of linear regression is that there is a linear relationship between the dependent variable and the independent variable(s). This implies that the relationship can be best represented by a straight line. If the relationship is non-linear, then linear regression may not be the appropriate model to use.
Independence: Another assumption is that the observations are independent of each other. In other words, the values of the dependent variable for one observation should not be influenced by the values of the dependent variable for other observations. Violation of this assumption may lead to biased and inefficient coefficient estimates.
Homoscedasticity: Homoscedasticity refers to the assumption that the variance of the errors is constant across all levels of the independent variables. This means that the spread of the residuals should remain consistent as the predicted values of the dependent variable change. Violation of homoscedasticity may result in biased standard errors and invalid hypothesis tests.
Normality: The residuals, which are the differences between the observed and predicted values of the dependent variable, should follow a normal distribution. The assumption of normality is important as it enables the use of statistical tests and confidence intervals based on the assumption of normality. Departure from normality may affect the validity of the p-values and confidence intervals produced by the model.
No multicollinearity: Multicollinearity occurs when two or more independent variables in the model are highly correlated with each other. This makes it difficult to determine the unique contribution of each variable to the dependent variable. It is important to detect and address multicollinearity, as it can lead to unstable and inaccurate coefficient estimates.
These assumptions provide the foundation for a valid and reliable linear regression model. Violation of any of these assumptions may lead to biased and inefficient parameter estimates, inaccurate hypothesis tests, and unreliable predictions. Therefore, it is crucial to evaluate and assess these assumptions before drawing conclusions based on a linear regression model.