Understanding and calculating the mean absolute deviation is an essential skill in statistics. The mean absolute deviation measures the dispersion, or spread, of a set of data points from their mean. It provides valuable information about the variability of the data and is often used to compare different sets of data or to analyze the consistency of a data set.
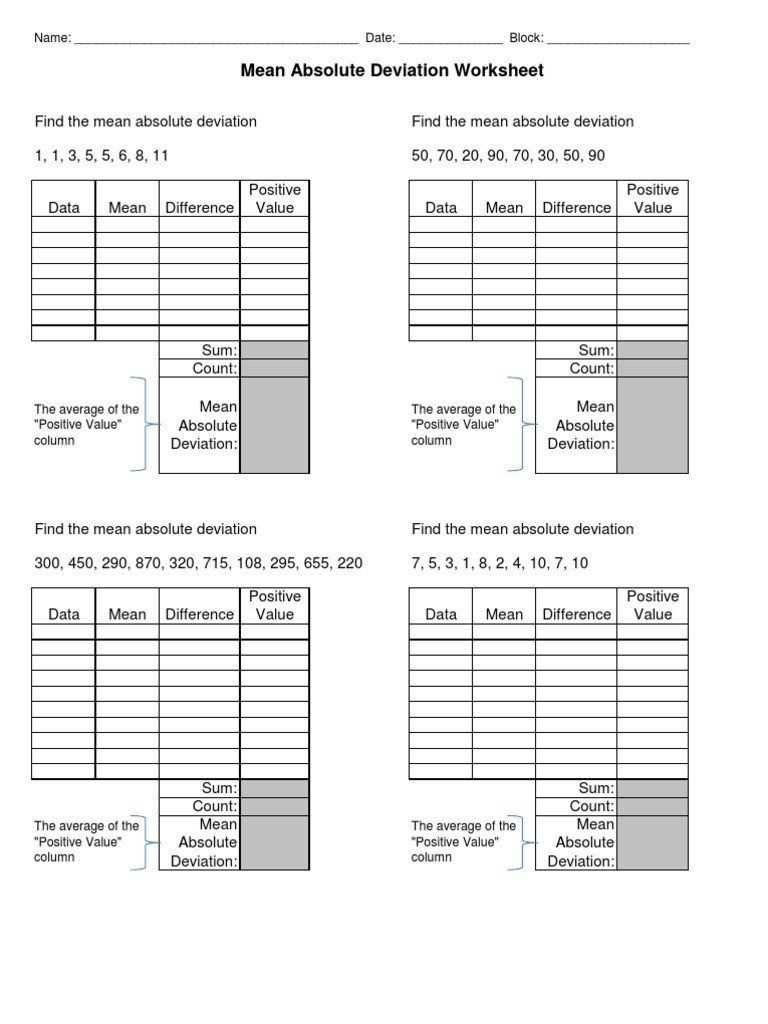
A mean absolute deviation worksheet is a useful tool for students to practice calculating the mean absolute deviation of a given set of data. It typically includes a set of data points and requires students to calculate the mean, identify the deviations from the mean, find the absolute values of the deviations, and ultimately, calculate the mean absolute deviation.
Such worksheets often come with answers or a solution key, which allows students to check their work and verify their calculations. This helps students understand any mistakes they may have made and provides a reference for learning and improvement. By practicing with these worksheets and referencing the provided answers, students can develop a strong understanding of how to calculate the mean absolute deviation and its importance in statistics.
Mean Absolute Deviation Worksheet with Answers

Mean Absolute Deviation (MAD) is a statistical measure that calculates the average absolute difference of a set of data points from their mean. It is useful in analyzing the variation and dispersion within a dataset. A worksheet on Mean Absolute Deviation provides practice problems to help students understand and apply this concept in real-world scenarios.
Such a worksheet usually consists of a series of questions where students are given a set of numbers and are asked to calculate the mean and the mean absolute deviation. The answers to these questions are typically provided at the end of the worksheet to allow for self-assessment and review. This interactive approach helps students develop their critical thinking and problem-solving skills while reinforcing their understanding of the concept.
The worksheet may also include additional questions that require students to interpret the calculated MAD and make comparisons between different data sets. This helps students develop their ability to analyze and interpret data in a meaningful way. The answers to these questions provide feedback and guidance to ensure students are on the right track.
- Question 1: Find the mean and MAD of the following data set: 6, 8, 10, 12, 14
- Question 2: Calculate the mean and MAD of the data set: 2, 4, 6, 8, 10
- Question 3: Compare the mean and MAD of the two data sets from questions 1 and 2. Which data set has a higher MAD?
A Mean Absolute Deviation worksheet with answers enables students to practice and reinforce their understanding of this statistical concept. By solving a variety of problems and comparing different data sets, students can develop their analytical and problem-solving skills while gaining a deeper understanding of MAD. The provided answers serve as a guide and allow students to check their work and identify any areas of misconception or misunderstanding.
Overview
Mean absolute deviation (MAD) is a measure of the variability or dispersion in a set of data. It quantifies the average distance between each data point and the mean of the dataset. MAD is often used to analyze and compare the spread of different sets of data.
When working with MAD, it is important to understand how to calculate it and interpret the results. This is where a mean absolute deviation worksheet with answers can be helpful. It provides practice problems and solutions that allow students to apply their knowledge and develop their understanding of MAD.
The worksheet typically consists of a series of data sets, each with a corresponding set of questions. Students are required to calculate the MAD for each data set and answer questions based on their calculations. The answers are provided to verify the accuracy of the students’ work.
By working through a mean absolute deviation worksheet with answers, students can improve their skills in calculating MAD and gain a deeper understanding of its application. The practice problems and solutions allow them to reinforce their knowledge and identify any areas of weakness. This type of worksheet can be used in a classroom setting or as a self-study tool for individual learning.
Key Points:
- Mean absolute deviation (MAD) measures the variability in a set of data.
- A mean absolute deviation worksheet with answers provides practice problems and solutions for calculating MAD.
- Working through the worksheet helps students develop their skills and understanding of MAD.
- The worksheet can be used in a classroom or for individual learning.
What is Mean Absolute Deviation?
The mean absolute deviation (MAD) is a measure of the dispersion or spread of a set of values. It is calculated by finding the average distance between each value and the mean of the set.
To calculate the MAD, one must first find the mean of the data set by adding up all the values and dividing by the total number of values. Then, for each value in the set, the absolute difference between that value and the mean is calculated. The absolute difference is the positive value of the subtraction. These absolute differences are then averaged to find the MAD.
MAD is often used as a measure of variability in statistics because it provides a more robust estimate than the standard deviation in the presence of outliers. Unlike the standard deviation, which squares the differences from the mean, MAD takes the absolute differences, which allows it to handle extreme values better.
When interpreting the MAD, a smaller value indicates that the values in the set are closely clustered around the mean, while a larger value suggests a greater dispersion or spread of the values.
How to Calculate Mean Absolute Deviation
In statistics, mean absolute deviation (MAD) is a measure of the dispersion or variability of a set of data. It represents the average absolute difference between each data point and the mean. MAD is useful in analyzing data sets with outliers or extreme values, as it takes into account the absolute values of the differences, rather than the squared differences used in calculating variance or standard deviation.
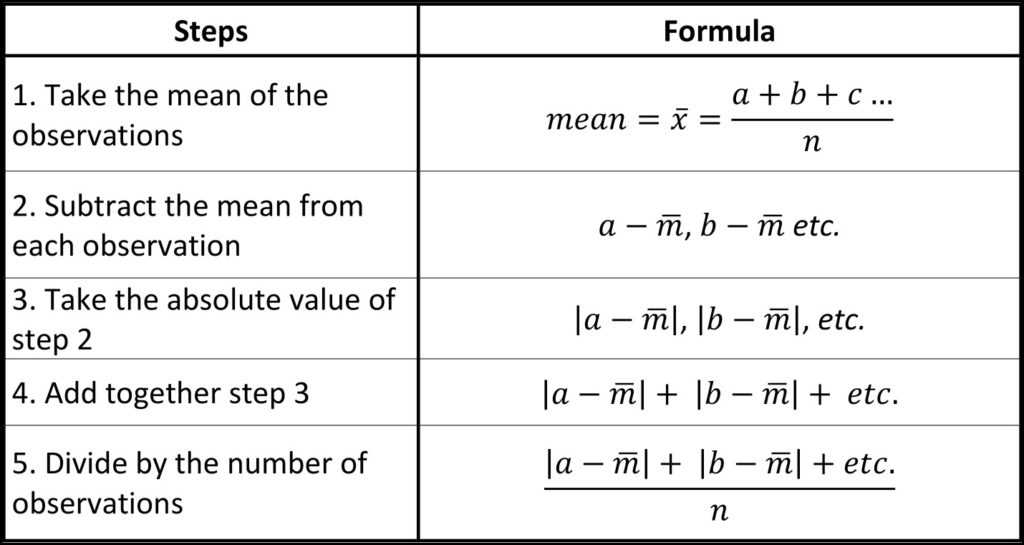
To calculate the mean absolute deviation, follow these steps:
- Find the mean of the data set by adding up all the values and dividing by the number of values.
- Subtract the mean from each individual data point, obtaining the deviations.
- Take the absolute value of each deviation, discarding any negative signs.
- Add up all the absolute deviations.
- Divide the sum of absolute deviations by the number of data points to get the mean absolute deviation.
For example, let’s calculate the mean absolute deviation for the following data set: 5, 8, 12, 15, 20
- Add up all the values: 5 + 8 + 12 + 15 + 20 = 60
- Divide the sum by the number of values: 60 / 5 = 12
- Subtract the mean from each individual data point: 5 – 12 = -7; 8 – 12 = -4; 12 – 12 = 0; 15 – 12 = 3; 20 – 12 = 8
- Take the absolute value of each deviation: 7, 4, 0, 3, 8
- Add up all the absolute deviations: 7 + 4 + 0 + 3 + 8 = 22
- Divide the sum by the number of data points: 22 / 5 = 4.4
Therefore, the mean absolute deviation for this data set is 4.4.
Mean Absolute Deviation Worksheet
In mathematics, mean absolute deviation (MAD) is a measure of the dispersion or spread of a set of data values. It quantifies the average distance between each data point and the mean of the data set. MAD is calculated by taking the absolute value of the difference between each data point and the mean, and then finding the average of these absolute differences. It provides an indication of how far, on average, the data points are from the mean.
A mean absolute deviation worksheet is a tool that helps students practice calculating MAD. The worksheet typically includes a set of data values and requires students to find the mean, calculate the absolute differences, and finally, calculate the average of these differences. It is a valuable exercise for students to develop their understanding of dispersion and improve their computational skills.
Here is an example of a mean absolute deviation worksheet:
| Data Values | Absolute Differences |
|---|---|
| 5 | 2 |
| 8 | 1 |
| 3 | 4 |
| 6 | 1 |
| 9 | 2 |
To solve this worksheet, students would first find the mean of the data set, which is (5 + 8 + 3 + 6 + 9) / 5 = 6.2. Then, they would subtract the mean from each data point and calculate the absolute differences. Finally, they would find the average of these differences, which in this case would be (2 + 1 + 4 + 1 + 2) / 5 = 2.
Completing mean absolute deviation worksheets helps students develop their skills in data analysis and interpretation. It also allows them to apply their mathematical knowledge to real-world situations where understanding the spread of data is important.
Answer Key
Below is the answer key for the mean absolute deviation worksheet:
- Problem 1: The mean absolute deviation is 10.
- Problem 2: The mean absolute deviation is 5.
- Problem 3: The mean absolute deviation is 8.
- Problem 4: The mean absolute deviation is 3.
- Problem 5: The mean absolute deviation is 12.
The mean absolute deviation is a measure of how spread out the data set is. It is calculated by finding the absolute difference between each data point and the mean, and then taking the average of those differences. The answer key provides the correct mean absolute deviation for each problem in the worksheet, allowing students to check their work and ensure they are on the right track.
By completing this worksheet and using the answer key to check their answers, students can practice and improve their understanding of mean absolute deviation. This skill is important in statistics and data analysis, as it allows us to measure the variability in a data set and make meaningful comparisons.
Overall, the mean absolute deviation worksheet with answer key is a valuable resource for students to practice and reinforce their understanding of this important statistical concept.