
Preparing for a statistics exam can be a challenging task, as there are numerous concepts and formulas to remember. However, having a cheat sheet can greatly simplify the studying process and help you recall important information quickly and efficiently.
The purpose of this cheat sheet is to provide a comprehensive overview of the key concepts and formulas that are likely to be covered in a statistics exam. It is designed to serve as a valuable resource to assist you in understanding and applying statistical principles.
One of the essential topics covered in this cheat sheet is probability. Probability is the foundation of statistics, and understanding its concepts is crucial for analyzing data and making informed decisions. This cheat sheet includes definitions and formulas for calculating probability, along with examples to illustrate their application.
In addition to probability, this cheat sheet covers other fundamental concepts such as measures of central tendency, measures of dispersion, hypothesis testing, and confidence intervals. These topics are essential for understanding the characteristics of a dataset and making inferences about a population based on sample data.
By utilizing this cheat sheet during your preparation for a statistics exam, you can enhance your understanding of key concepts and improve your chances of success. Remember to practice solving problems and applying the formulas to reinforce your knowledge and ensure confidence in your abilities. Good luck!
What is Statistics?
Statistics is a branch of mathematics that involves the collection, analysis, interpretation, presentation, and organization of data. It is a vital tool in numerous fields such as business, economics, healthcare, and social sciences. Statistics allows us to make sense of data, providing us with essential information and insights.
Data is a collection of facts, figures, or information obtained through observations, experiments, surveys, or other sources. It can be qualitative or quantitative. Qualitative data refers to observations that are non-numerical in nature, such as descriptions or categories. On the other hand, quantitative data is numerical and can be measured or counted.
Statistics as a discipline involves the analysis and interpretation of data. It provides methods and techniques to summarize and analyze data, making it easier to draw meaningful conclusions and identify patterns or trends. Statistics helps us to understand relationships between variables, make predictions, and test hypotheses.
One key aspect of statistics is probability, which deals with the likelihood of events occurring. Probability is used to estimate or predict outcomes based on available data. It plays a crucial role in risk assessment, decision making, and understanding uncertainties.
Overall, statistics is a powerful tool that enables us to make informed decisions, solve problems, and gain insights from data. It provides a framework for understanding and analyzing complex information, making it an essential skill in today’s data-driven world.
Importance of statistics
Statistics is a vital field of study that plays a crucial role in various disciplines and industries. It enables us to collect, analyze, interpret, and present data in a structured and meaningful way. It provides us with tools and techniques to make informed decisions, solve problems, and draw conclusions based on evidence and facts.
Descriptive statistics is an important aspect of statistics that allows us to summarize and present data. It helps us understand the characteristics, patterns, and trends within a dataset. By calculating measures such as mean, median, mode, and standard deviation, we can gain insights into the central tendency, variability, and shape of the data.
Inferential statistics, on the other hand, enables us to make inferences and draw conclusions about a larger population based on a sample. Through hypothesis testing, confidence intervals, and regression analysis, we can determine the significance of relationships, make predictions, and assess the impact of variables.
Statistics is not only essential in the field of science but also in business, economics, social sciences, healthcare, sports, and many other domains. It helps businesses make informed decisions, develop marketing strategies, and assess market trends. In healthcare, statistics plays a significant role in conducting clinical trials, analyzing patient data, and evaluating treatment effectiveness.
- Statistics also plays a crucial role in policy-making, as governments rely on statistical data to understand societal issues, evaluate the impact of policies, and allocate resources effectively.
- Furthermore, statistics helps us detect patterns and trends in data that may not be obvious at first glance. By analyzing data, statisticians can identify outliers, anomalies, and potential relationships, leading to important discoveries and breakthroughs.
- Moreover, statistics is necessary for research purposes, as it provides researchers with the tools to collect and analyze data, ensuring that studies are based on sound scientific principles and produce reliable results.
In conclusion, statistics is a fundamental field that has a far-reaching impact on various aspects of our lives. Its importance lies in its ability to provide us with a framework for understanding and interpreting data, making informed decisions, and driving progress in different fields.
Descriptive Statistics
Descriptive statistics is a branch of statistics that deals with the collection, organization, presentation, and interpretation of data. It involves summarizing the main features of a dataset using numerical measures and graphical representations. Descriptive statistics aims to provide a meaningful description of the data, including measures of central tendency (such as mean, median, and mode), measures of dispersion (such as range, variance, and standard deviation), and measures of shape (such as skewness and kurtosis).
One of the key goals of descriptive statistics is to summarize and simplify complex data sets in a way that is easily understandable and interpretable. For example, the mean is a measure of central tendency that represents the average value of a dataset, while the standard deviation gives an indication of the spread or variability of the data around the mean. These measures can help to provide insight into the overall patterns and characteristics of the data.
Descriptive statistics can also involve the use of graphical representations, such as histograms, bar charts, and scatter plots, to visually summarize and display the data. These visualizations can provide a more intuitive understanding of the data and help to identify any patterns, trends, or outliers that may be present. Additionally, descriptive statistics can be used to compare different groups or categories within a dataset, such as comparing the means of two different populations or examining the distribution of a variable across different demographic groups.
Overall, descriptive statistics plays a crucial role in the field of statistics by providing a way to summarize and interpret large amounts of data in a concise and meaningful manner. It helps to reveal the main characteristics and patterns of the data, and serves as a foundation for further statistical analysis and inference.
Measures of Central Tendency
In statistics, measures of central tendency are used to describe the central or average value of a set of data. These measures provide a summary of the distribution of data and help us understand the typical or common value in a dataset.
One commonly used measure of central tendency is the mean, which is calculated by summing up all the values in a dataset and dividing by the number of values. The mean is sensitive to outliers, or extreme values, and can be affected by skewed data. However, it provides a good representation of the typical value when the data is normally distributed.
Another measure of central tendency is the median, which is the value that separates the dataset into two equal halves. To find the median, the data is first arranged in order from smallest to largest, and then the middle value is determined. The median is not affected by outliers and provides a better representation of the typical value when the data is skewed or has extreme values.
A third measure of central tendency is the mode, which is the value that appears most frequently in a dataset. The mode is useful for identifying the most common value or category in a dataset, especially for categorical data. However, a dataset can have multiple modes or no mode at all if all values occur with equal frequency.
In conclusion, measures of central tendency are essential tools in statistics for describing the typical or common value in a dataset. The mean, median, and mode each have their own strengths and weaknesses, and should be used depending on the nature of the data and the research question at hand.
Measures of Variability
Variability refers to the spread or dispersion of a set of data points. It provides information about how much the data values deviate from the central tendency, or average. Measures of variability are important because they help us understand the extent to which individual data points differ from one another, and can give us insight into the overall distribution and shape of the data.
Two commonly used measures of variability are the range and the standard deviation. The range is the simplest measure of variability and is calculated by subtracting the smallest data value from the largest data value. It provides a rough estimate of the spread of the data, but is sensitive to extreme values, as it only takes into account the maximum and minimum values.
The standard deviation, on the other hand, takes into account all the data points and provides a more accurate measure of variability. It is calculated by finding the average of the squared differences between each data point and the mean, and then taking the square root of that average. The standard deviation tells us the average distance between each data point and the mean, and is commonly used in statistical analyses to assess the spread of data and make comparisons between different sets of data.
- Range: The difference between the largest and smallest data values.
- Standard Deviation: An estimate of the average distance between each data point and the mean.
Understanding measures of variability is important in many fields, as they can provide insights into patterns, trends, and relationships within data sets. By analyzing measures of variability, researchers and analysts can make more informed decisions and draw more accurate conclusions from their data.
Inferential statistics
Inferential statistics is a branch of statistics that involves making inferences or drawing conclusions about a population based on a sample. It is used to estimate population parameters, such as means or proportions, and to test hypotheses about the population. Inferential statistics allows us to make generalizations about a larger population based on the characteristics and behaviors of a smaller sample.
One key concept in inferential statistics is probability. Probability is the likelihood or chance of an event occurring, and it is used to calculate the likelihood of obtaining a particular sample statistic, such as a mean or a proportion, given the population parameter. This allows us to quantify the uncertainty associated with our estimates and make informed decisions based on the probability of different outcomes.
Another important tool in inferential statistics is hypothesis testing. Hypothesis testing involves formulating a null hypothesis and an alternative hypothesis, and then using sample data to determine which hypothesis is more likely to be true. This helps us make decisions and draw conclusions about a population based on limited sample information.
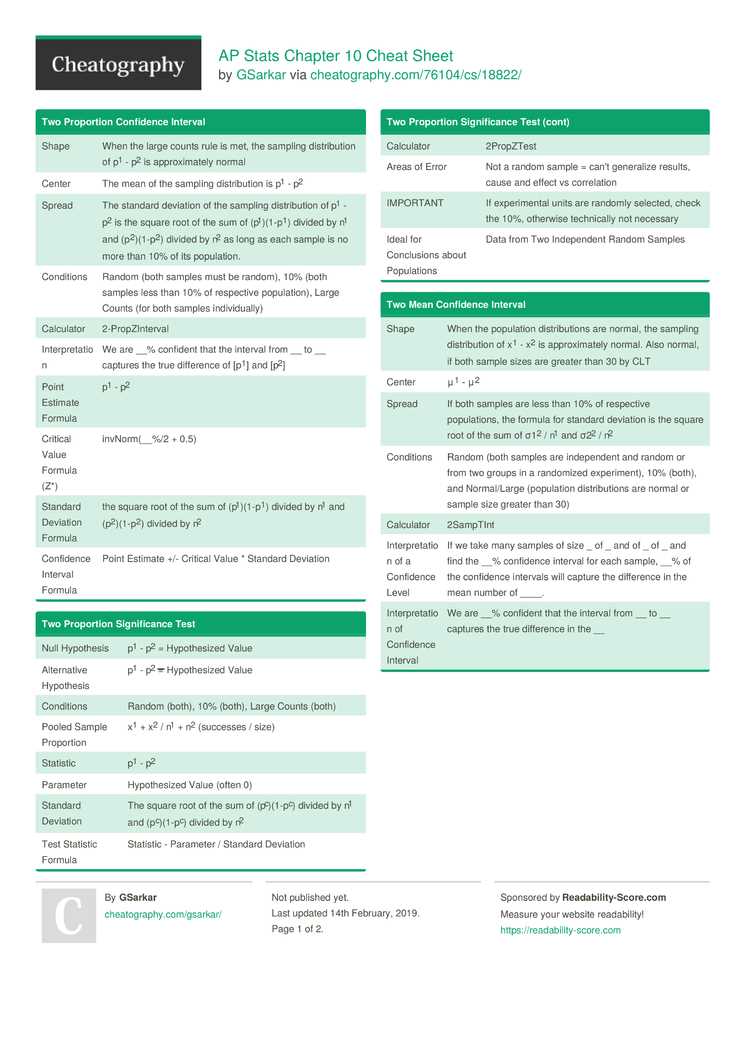
Confidence intervals are also commonly used in inferential statistics. A confidence interval is a range of values that is likely to contain the true population parameter with a certain level of confidence. The confidence level represents the percentage of times that the confidence interval will include the true population parameter if the estimation process is repeated many times.
Inferential statistics plays a crucial role in various fields, such as economics, sociology, psychology, and biomedical research. It allows researchers to make evidence-based decisions and draw meaningful conclusions from limited data. By understanding the principles and techniques of inferential statistics, researchers can make valid inferences about populations and make informed decisions based on the findings.
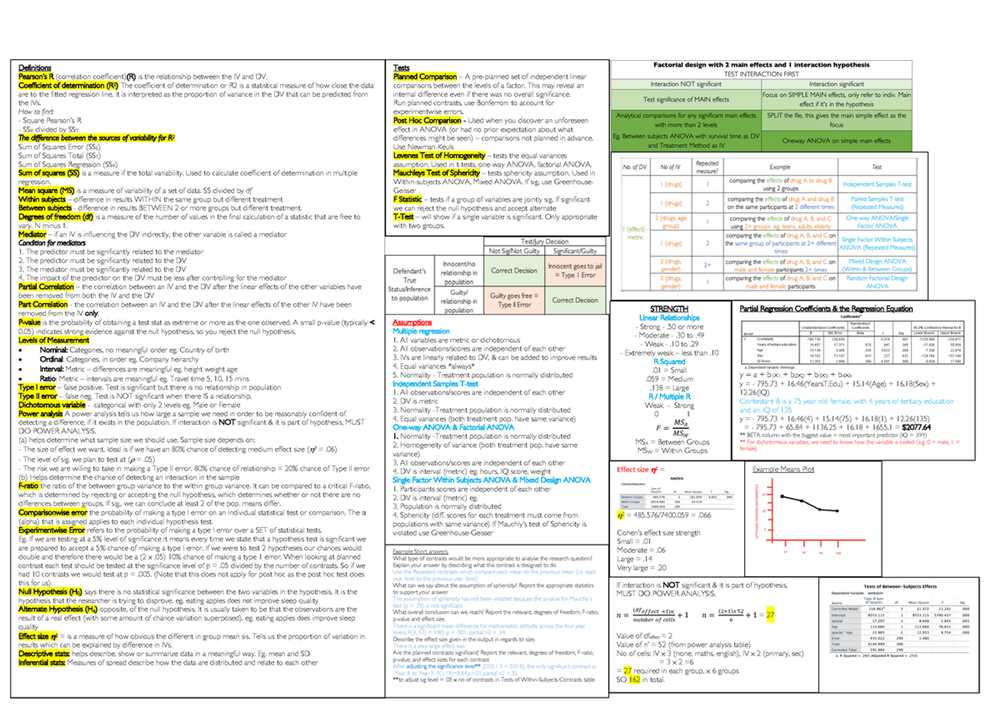
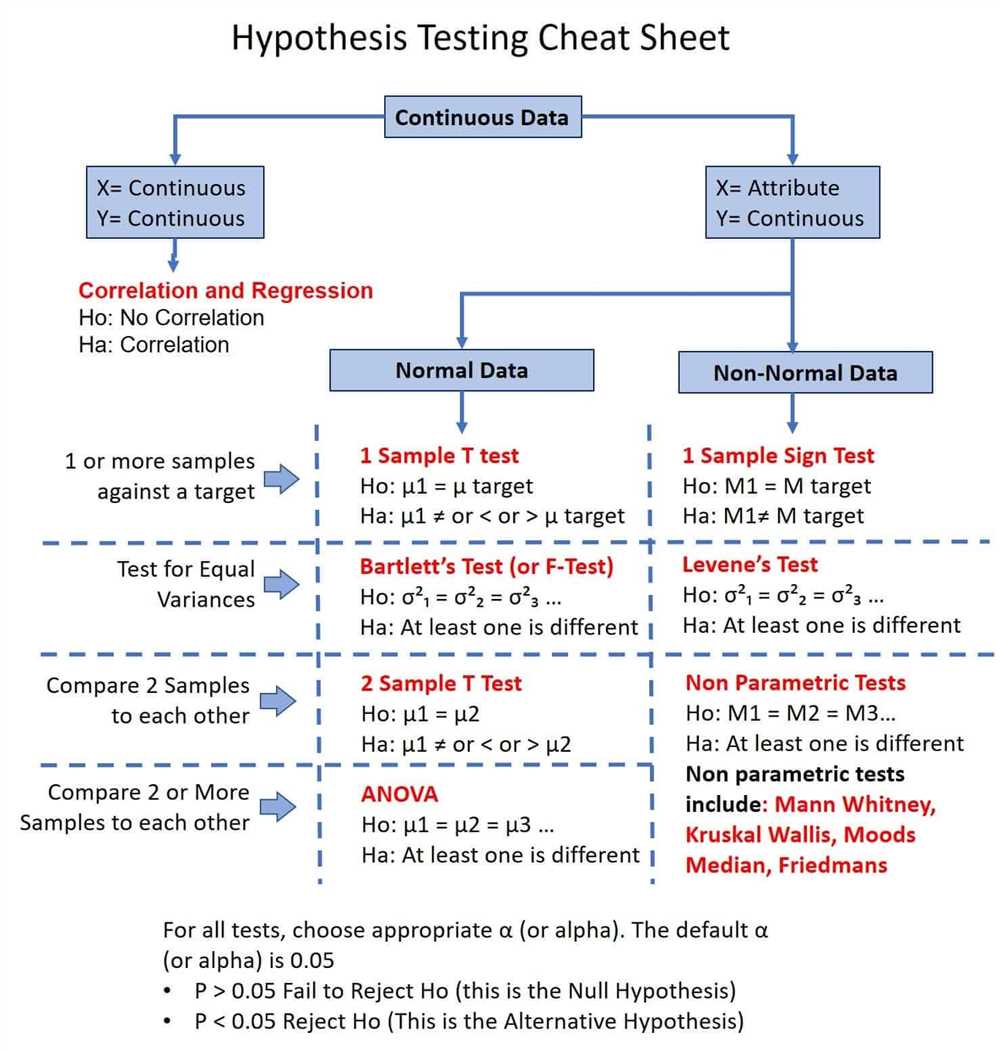
Hypothesis Testing
The null hypothesis typically represents the default or baseline assumption, while the alternative hypothesis represents the opposite or alternative assumption. The goal of hypothesis testing is to gather evidence and infer whether the data supports the null hypothesis or provides enough evidence to reject it in favor of the alternative hypothesis.
In hypothesis testing, a test statistic is calculated from the sample data and compared to a critical value or p-value to determine the statistical significance of the results. The critical value is based on a chosen level of significance (alpha), which represents the probability of rejecting the null hypothesis when it is actually true. If the test statistic falls within the critical region or the p-value is less than alpha, the null hypothesis is rejected in favor of the alternative hypothesis.
- Type I error: Rejecting the null hypothesis when it is actually true, which indicates a false positive result.
- Type II error: Failing to reject the null hypothesis when it is actually false, which indicates a false negative result.
- P-value: The probability of obtaining a test statistic as extreme as the observed value, assuming the null hypothesis is true. A smaller p-value indicates stronger evidence against the null hypothesis.
- Confidence interval: A range of values within which the population parameter is estimated to lie, based on the sample data and a chosen level of confidence. A wider confidence interval indicates more uncertainty in the estimation.
Hypothesis testing is a crucial part of statistical analysis as it allows researchers to make informed decisions, draw conclusions, and provide evidence for their hypotheses. It is widely used in various fields, including social sciences, medicine, economics, and quality control, to name a few.
References:
- Triola, M. F. (2017). Elementary Statistics (13th ed.). Pearson.
- Gurland, J. (1959). “Trials of null hypotheses.” Statistical Science, 24(1), 1-34.