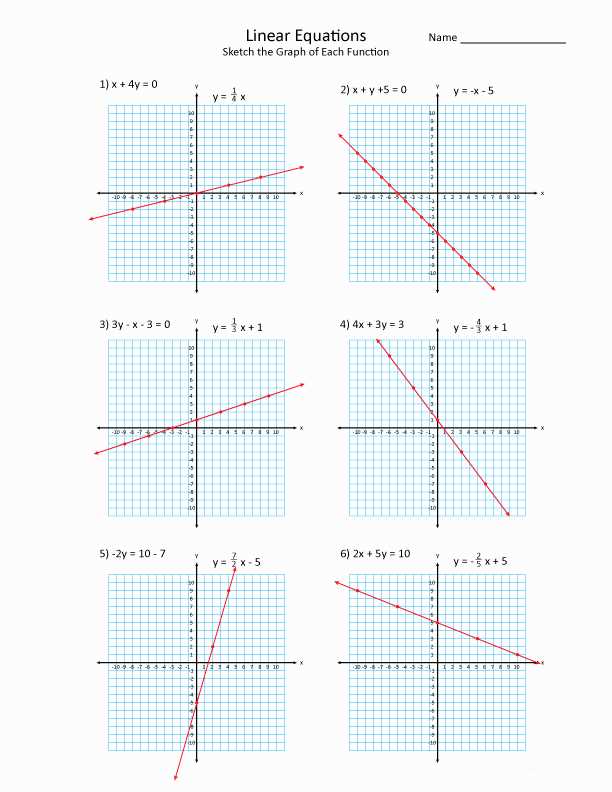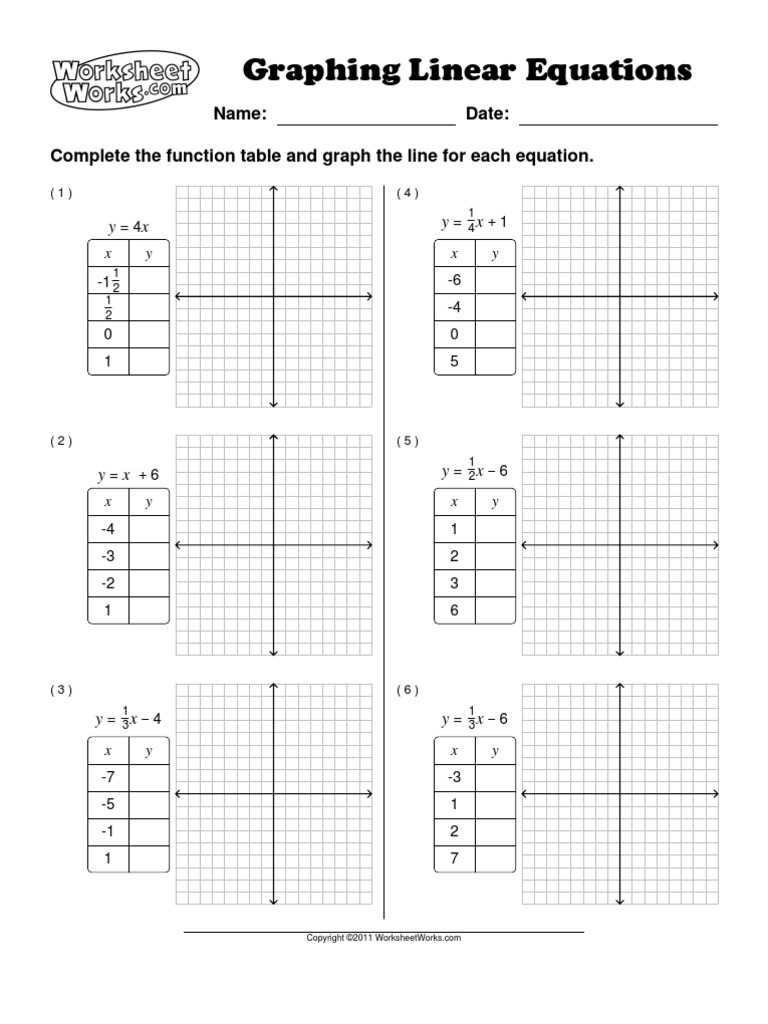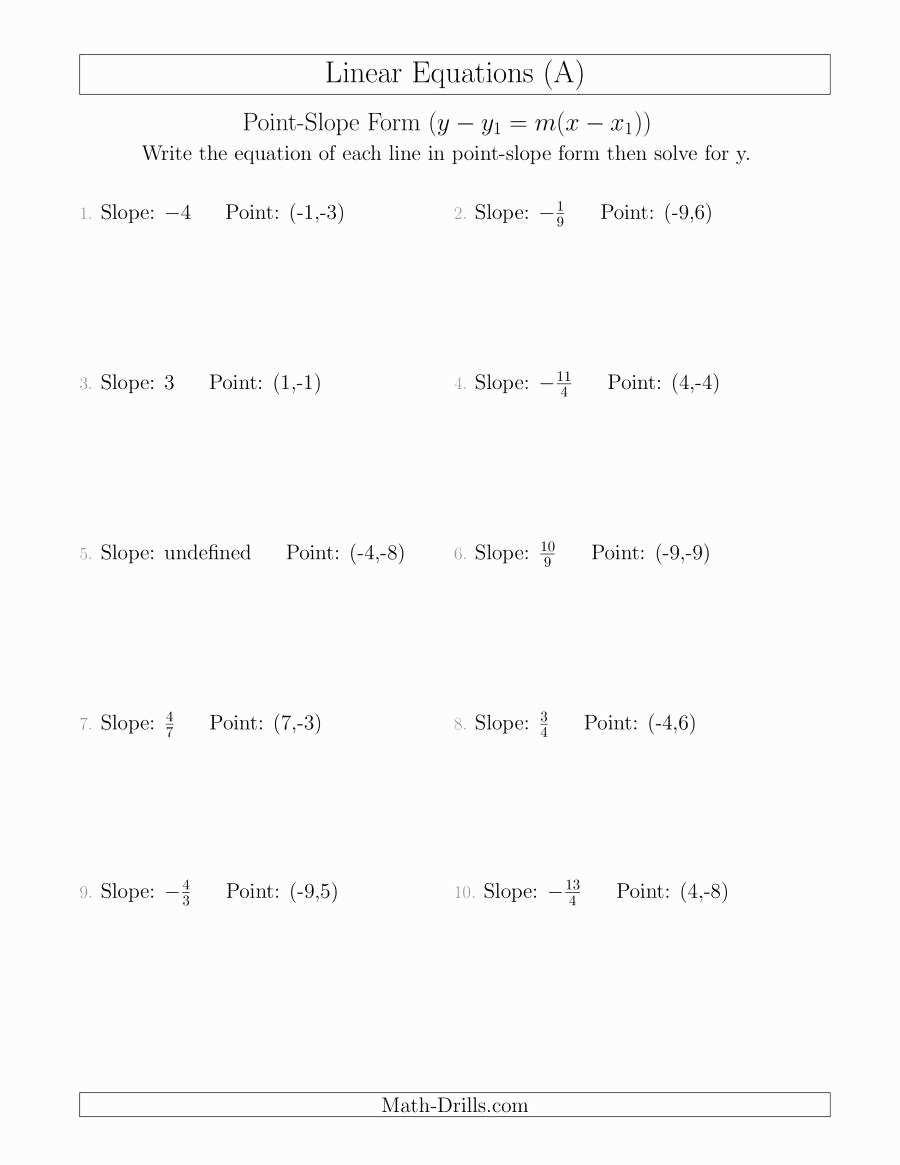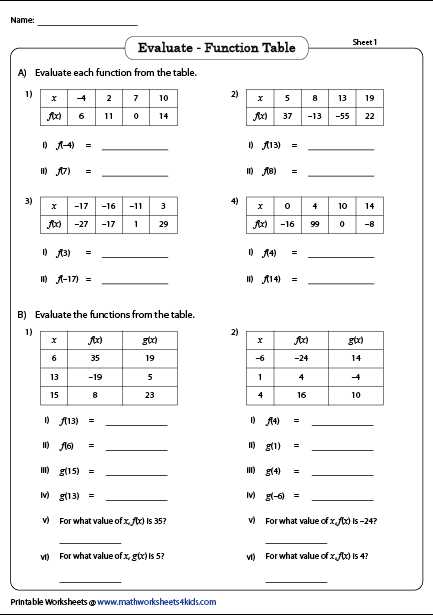
Writing linear equations from a table is an essential skill in algebra and is often used to represent and describe real-world situations. A linear equation is an equation with variables that form a straight line when graphed on a coordinate plane. By using a table of values, we can determine the relationship between the variables and write an equation that represents that relationship.
This worksheet answer key is a valuable resource for teachers and students alike, as it provides the correct answers and explanations for a set of practice problems. The key helps students understand the process of writing linear equations from a table by breaking it down step by step. It includes examples that cover various scenarios, such as finding the equation given the slope and y-intercept, or finding the equation given two points on the line.
Having access to the worksheet answer key allows students to check their work and identify any mistakes they may have made. It also serves as a reference for understanding the correct approach to solving each problem. By practicing with this answer key, students can gain confidence in their ability to write linear equations from a table and apply this skill to other algebraic problems.
- Understanding linear equations and tables
Linear equations and tables are fundamental concepts in algebra that provide a way to represent and analyze relationships between variables. A linear equation is an equation that can be written in the form y = mx + b, where m is the slope of the line and b is the y-intercept. The slope represents the rate of change, or how much y changes for every unit change in x, while the y-intercept represents the value of y when x is 0.
When working with linear equations, it can be helpful to create a table of values that represents the relationship between x and y. This table lists different values of x and their corresponding values of y, which can then be used to plot points on a graph and draw a line that represents the equation.
To create a table of values from a linear equation, choose different values for x and calculate the corresponding values of y using the equation. For example, if the equation is y = 2x + 3, you can choose x = 0, 1, 2, and so on, and calculate the values of y as follows:
| x | y |
|---|---|
| 0 | 3 |
| 1 | 5 |
| 2 | 7 |
Once you have the table of values, you can plot the points (0,3), (1,5), (2,7) on a graph and draw a straight line that passes through these points. This line represents the equation y = 2x + 3.
Understanding linear equations and tables is essential for solving problems involving rates of change, finding the slope and y-intercept, and determining the relationship between variables. It provides a powerful tool for analyzing and representing real-world situations and helps in making predictions and decisions based on data.
Step-by-step guide to writing linear equations from a table

Writing linear equations from a table can be a straightforward process if you follow a step-by-step approach. By examining the given data and analyzing the relationship between the independent and dependent variables, you can determine the equation that represents the linear relationship. Here’s how to do it:
Step 1: Identify the independent and dependent variables

In the given table, identify the column that represents the independent variable (usually the x-values) and the column that represents the dependent variable (usually the y-values). This will help you understand how the variables are related to each other.
Step 2: Determine the slope
Next, calculate the slope of the linear relationship. The slope represents the rate of change between the two variables. To do this, select any two data points from the table and use the formula: slope = (change in y)/(change in x). This will give you the rate at which the dependent variable changes for each unit change in the independent variable.
Step 3: Find the y-intercept

To find the y-intercept, which is the point where the line crosses the y-axis, you need to identify the y-value when the independent variable is equal to zero. Look for a data point in the table where the x-value is zero and note the corresponding y-value.
Step 4: Write the equation
Finally, you can write the equation using the slope-intercept form: y = mx + b, where m represents the slope and b represents the y-intercept. Substitute the values you calculated for the slope and y-intercept into the equation, and you have successfully written the linear equation from the table.
By following these steps, you can easily write linear equations from a table. Remember to double-check your work and ensure that the equation accurately represents the relationship between the variables in the table.
Common mistakes to avoid when writing linear equations from a table
Writing linear equations from a table can be a challenging task for some students. It requires a good understanding of how to interpret the data and translate it into the correct equation. However, there are a few common mistakes that students often make, which can lead to incorrect equations and answers.
1. Incorrectly identifying the slope: One of the most common mistakes is identifying the slope incorrectly. The slope is the coefficient of the x-term in the equation. In a table, it can be calculated by finding the difference in y-values and dividing it by the difference in x-values. Students should be careful to calculate the slope accurately and use the correct sign (+ or -) in the equation.
2. Using the wrong form of the equation: Another mistake students make is using the wrong form of the equation. The standard form of a linear equation is Ax + By = C, where A, B, and C are constants. Sometimes students mistakenly use the slope-intercept form y = mx + b or the point-slope form y – y1 = m(x – x1) instead. It is important to use the correct form of the equation to ensure the accuracy of the answer.
3. Not checking for consistency: Students often forget to check if the equation they have derived from the table is consistent with the other data points in the table. They may fail to verify if the equation accurately represents all the points in the table. It is important to plug in the x and y-values of different points into the equation to ensure that they satisfy the equation. Inconsistencies may indicate errors in the equation.
4. Misinterpreting data points: Misinterpreting the data points in the table can also lead to mistakes in writing linear equations. Students may incorrectly assign the x and y-values to the coordinates, resulting in incorrect calculations and equations. It is important to carefully read and understand the data points in the table before attempting to write the equation.
By being aware of these common mistakes, students can improve their accuracy in writing linear equations from a table. Practice and double-checking the work can also help in avoiding these errors and ensuring the correct answers.
Applying Linear Equations to Real-World Problems
Linear equations play a crucial role in solving real-world problems across various fields, including physics, economics, and engineering. They provide a mathematical framework for understanding and predicting how variables change in relation to each other.
For example, let’s consider a scenario where a company is looking to determine the total cost of producing a certain number of products. They know that the cost consists of both fixed and variable components. By using a linear equation, they can model the relationship between the number of products produced and the total cost.
| Number of Products | Total Cost |
|---|---|
| 0 | $500 |
| 100 | $1,500 |
| 200 | $2,500 |
| 300 | $3,500 |
| 400 | $4,500 |
Using the provided data in the table, we can create a linear equation:
Total cost = fixed cost + (variable rate * number of products)
By using the first set of data points from the table (0 products, $500 total cost), we can substitute these values into the equation and solve for the fixed cost:
500 = fixed cost + (variable rate * 0)
Since the variable rate multiplied by 0 is 0, we can conclude that the fixed cost is $500.
With the fixed cost determined, we can further analyze the data to find the variable rate by using any other set of data points from the table.
- Using the second set of data points (100 products, $1,500 total cost):
- 1500 = 500 + (variable rate * 100)
- variable rate = ($1500 – $500) / 100 = $10
Therefore, the linear equation representing the relationship between the number of products and the total cost is:
Total cost = $500 + ($10 * number of products)
This equation can now be used to predict the total cost for any number of products within the given range.
Practicing Writing Linear Equations from a Table with Worksheet Examples: Summary
Writing linear equations from a table is an essential skill in algebra. It allows us to represent and model real-life situations using mathematical equations. In this article, we discussed the process of converting data from a table into a linear equation.
We started by understanding the basic concept of a linear equation, which is an equation that represents a straight line when graphed. Linear equations have the form y = mx + b, where m represents the slope and b represents the y-intercept. The slope tells us how the y-values change as the x-values change, while the y-intercept represents the point where the line crosses the y-axis.
We then explored a step-by-step approach to writing linear equations from a table. We learned how to calculate the slope by finding the change in y-values (vertical change) divided by the change in x-values (horizontal change). Once we found the slope, we could determine the y-intercept by substituting the coordinates of a point from the table into the equation and solving for b.
To solidify our understanding, we practiced writing linear equations from a table with worksheet examples. These examples provided various sets of data, and we used the steps discussed to find the slope, y-intercept, and ultimately the equation for each table. By practicing these examples, we improved our skills in converting data from a table into a linear equation.
Writing linear equations from a table is valuable in many fields, such as physics, economics, and engineering. It allows us to analyze and predict relationships between variables in a clear and mathematically precise way. By mastering this skill, we can better understand the world around us and make informed decisions based on quantitative data.